Use Server-Sent Events and Node.js to show JET chart data

In my previous posts about JET I used REST to gather data. Now I want to see how JET works with SSE (Server-Sent Events). The idea is that SSE pushes stock data to the JET-page where a chart is shown.
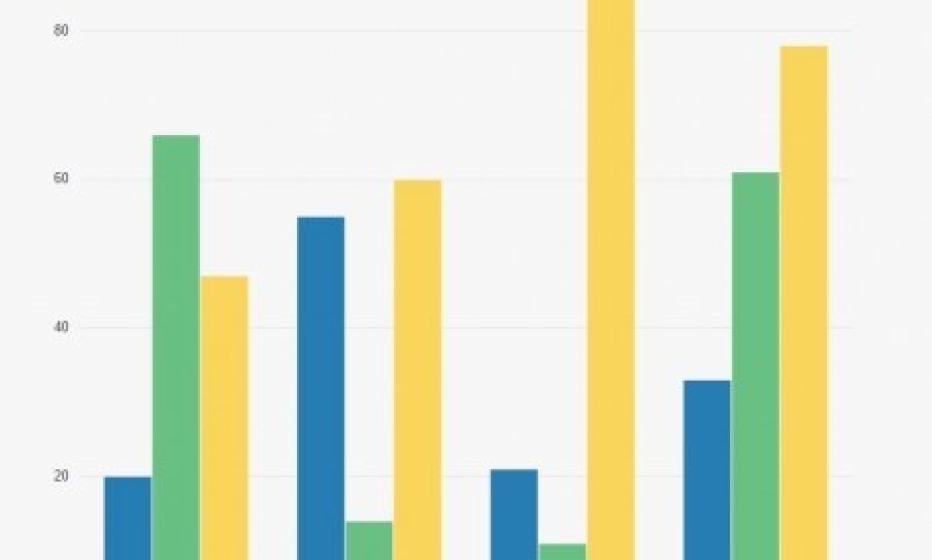
Below you can see a screenshot of the JET-page with a BarChart (you can see a video at the bottom of this post). As you can see I created four groups, representing four tech companies. The idea is that “Current” is the current stockrate, “-1” the previous “Current” and “-2” the previous “-1” so a user can see the flow of the rates.

To generate SSE I installed a Node.js server. This can easily be done in Netbeans. Maybe you already have done if you work with JET 2.0.
This is the Node.js script for the server side:
const http = require('http');
function CreateData() {
var data;
  data = [{'name' : 'Current','items' : [Math.floor(Math.random()*101),Math.floor(Math.random()*101),Math.floor(Math.random()*101),Math.floor(Math.random()*101)]},{'name' : '-1','items' : [Math.floor(Math.random()*101),Math.floor(Math.random()*101),Math.floor(Math.random()*101),Math.floor(Math.random()*101)]},{'name' :'-2', 'items' : [Math.floor(Math.random()*101),Math.floor(Math.random()*101),Math.floor(Math.random()*101),Math.floor(Math.random()*101)]}]  ;
  return JSON.stringify(data);
}
http.createServer( (req, res) => {
 var index = "./sse.htm";
  var interval;

    res.writeHead(200, {"Content-Type":"text/event-stream", "Cache-Control":"no-cache", "Connection":"keep-alive"});
    res.write("data: " + CreateData() + "nn");
    interval = setInterval(function() {
    res.write("data: " + CreateData() + "nn");
    }, 5000);
    req.connection.addListener("close", function () {
      clearInterval(interval);
    }, false);

}).listen(80, "127.0.0.1");
console.log("Server running at http://127.0.0.1:80/");
To start this script in Netbeans: go to the folder where the file is located and start with the following command:
$ node nodejs-sse.js
Server running at http://127.0.0.1:80/
And when everything is alright, the server is running!
That’s is all for the server-side. Let’s continue with the client-side.
I created a simple JET-page with a BarChart. This is the definition of the chart:
</div>
</div>
In the JavaScript implementation I added the code that listens to get the events:
var ev = new EventSource('http://127.0.01:80/');
           ev.addEventListener('message', function (event) {
            seriesValue(processSeries(JSON.parse(event.data)));
              });
This codes listens to the URL and the Node.js script sends an event. This event is processed in the function processSeries.
The code of the function processSeries is shown below:
function processSeries(data){
var seriesdata = {'groups': [], 'series': []};
var g;
var x;
var json;
var data_obj = {};
json = JSON.stringify(data);
data_obj = JSON.parse(json);
for (x = 0;x < data_obj.length;x++) {
    var nameVal = String(data_obj[x].name);
    seriesdata['series'].push({'name': nameVal, 'items': []});
     for (g =0; g< data_obj[x].items.length ; g++){
         var itemVal = String(data_obj[x].items[g]);
         seriesdata['series'][x]['items'].push(itemVal);
         }
    }
 return seriesdata['series'];
};
In this function I convert the object to an array. The data that is sent from via SSE contains three arrays with four sub-arrays.
When the Node.js server is running, you can run the JET-page and the data is automatically refreshed when an event is sent.
As Server-Sent Events are not supported yet by Internet Explorer and Edge, you should use another browser to use this functionality.


